
The questions customers ask before they buy, and the ones they ask when something goes wrong, are the most honest research you'll ever get. Read as a group rather than one at a time, they tell you which page is unclear, which product detail is missing, which policy people don't believe, and what you should build next. Most small businesses answer them and throw them away.
The reason this data is better than a survey is that nobody was asked to produce it. A customer typing "does this fit a 2019 model" at 11pm is telling you your product page is incomplete, and they're telling you at the exact moment it cost you a sale. One of those is an anecdote. Forty of them in a month is a specification. The trick is that the signal only appears in aggregate, and aggregating by hand is the part that never happens, because reading three months of chat transcripts is nobody's Tuesday. So the practical question isn't whether support questions are useful. It's how you get a monthly summary of them without a data team.
The four things questions actually tell you
What's unclear. A question you answer often is a page you wrote badly, or a page nobody can find. Shipping cutoffs and return windows are the usual suspects.
What's missing. Questions you have no answer for at all. These are the ones worth the most, because they're the gap between what you sell and what you've explained.
What people don't believe. When customers ask you to confirm something your site already says, the copy isn't landing. "Is shipping really free?" is a trust problem, not an information problem.
What to build. Repeated requests for a size, a feature, a payment method or a country. This is the list that should feed your roadmap, and it's usually more accurate than what your loudest customers ask for in email.
Start with a count, not a dashboard
You can do a useful version of this with a spreadsheet in an afternoon. Take the last 30 days of questions, one row each, and tag them with a short label: shipping, returns, sizing, order status, compatibility, billing. Then sort by count.
Two things jump out almost immediately. There's a label at the top you've been ignoring for months, and there's a tail of one-off questions where the interesting stuff hides.
You'll know the exercise worked when the top three labels surprise you at least once. If they don't, you either already knew your business cold or you tagged too coarsely.
Group by meaning, not by keyword
Keyword grouping fails here, and it fails in a way that hides your biggest problems. "Do you ship to Canada", "can i order from toronto" and "international delivery?" are one question with zero words in common.
Group by what people meant and the counts change shape. A topic you thought was a handful of stragglers turns out to be your second most common question, and it has no page.
This is also why country and language matter more than people expect. If a fifth of your questions arrive in German, that's not a translation task, it's a market you're serving badly by accident.
Watch the questions with no answer
Every question your content can't answer is a small, dated receipt for something you haven't written. Keep them in one list, ranked by how many people asked, and treat the top of that list as your content backlog.
Two useful habits go with it. Write the article in the customer's words rather than your internal vocabulary, because that's what the next person will search for. And when you publish, go back and check whether the underlying cause was really a missing article or a broken page, a confusing checkout step, a policy that doesn't make sense.
Do this monthly, and keep the history
The value compounds. One month of question data tells you what to fix. Six months tells you whether your fixes worked, which season brings which problem, and whether a new product launch created a new category of confusion.
Set a recurring 30 minutes. Read the top topics, read the unanswered list, write one or two things, and note what you changed so next month's numbers mean something. Skip the graphs. You're looking for "people keep asking X", not a trend line.
The failure mode isn't picking the wrong metric, it's letting the questions stay scattered across an inbox, a chat log and your phone. If it isn't in one place, the monthly read doesn't happen.
How Answer HQ turns questions into a read on your business
This is what Insights is for, on Pro and Growth. Every question your assistant handles is analyzed, then grouped into Topics by meaning rather than keyword match, using embedding similarity. That grouping works across languages, including Chinese, Japanese and Korean, so a question asked in German lands in the same topic as its English twin.
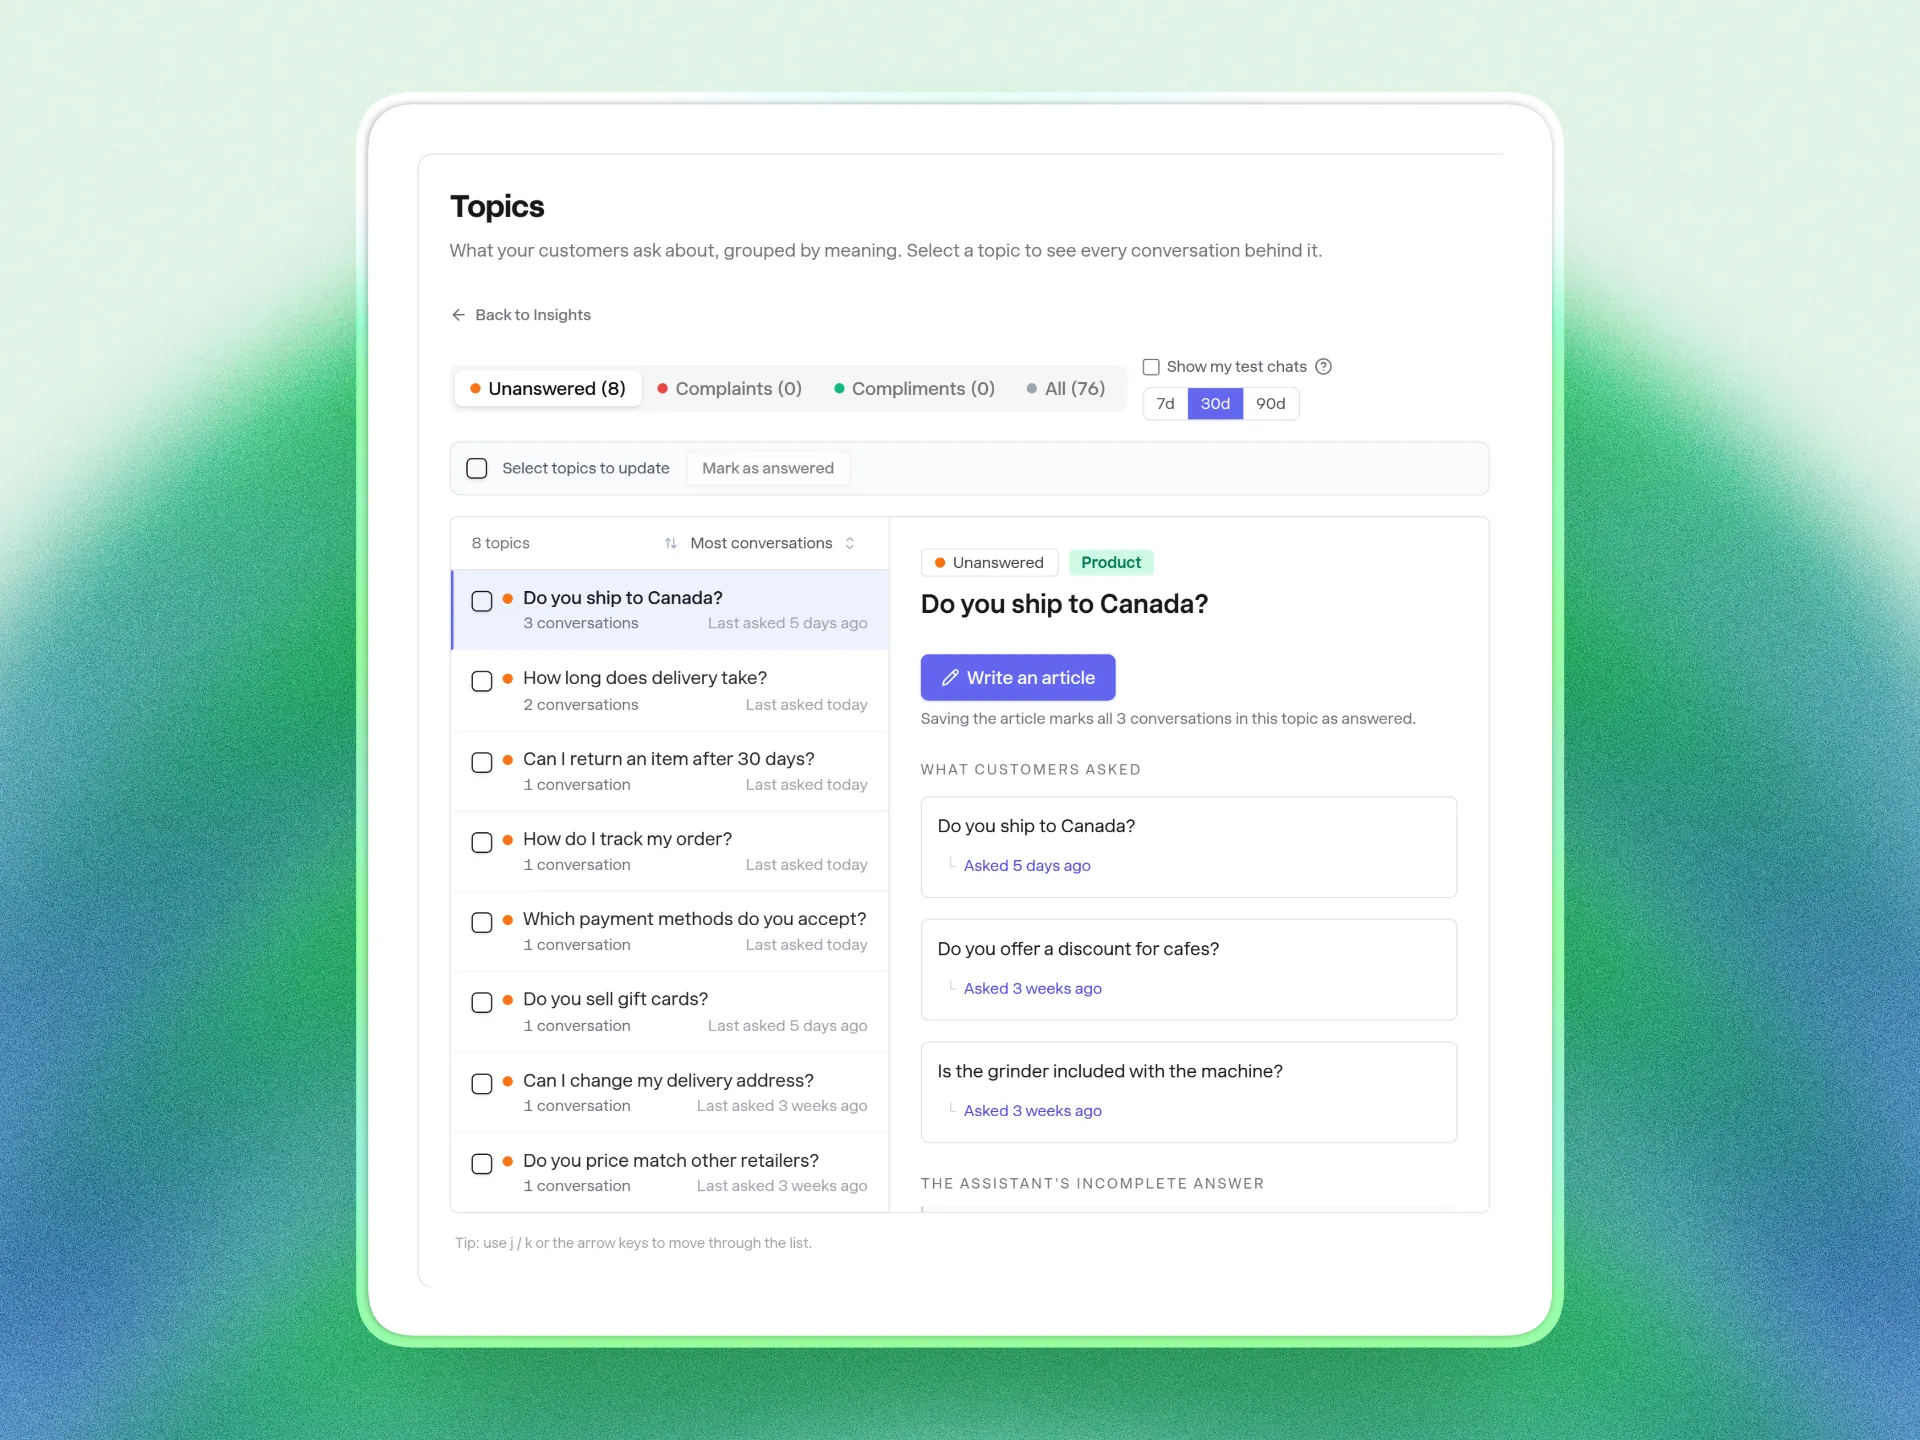
The Snapshot gives you headline numbers and Categories. Topics gives you the ranked list, and the part I use most is the knowledge gaps view: the questions customers asked that your content couldn't answer, ranked by how many people asked. It has a guided flow that pre-fills an article with the title, the category and the real customer questions behind the topic, and marks the whole topic resolved when you save. Complaints and compliments get summarized separately, which is the fastest way to find out that a shipping partner has started letting you down.
One detail worth knowing: chats are analyzed on every plan, so the data is being collected even on Basic. Only Pro and Growth can view the dashboard, which means upgrading lights up your history immediately instead of starting from zero.
On Pro and Growth you can also just ask. Autopilot is a dashboard agent you talk to in plain language about your own support data, and it can take dashboard actions for you. Anything risky, like publishing or editing an article, waits for your explicit approval before it runs.
Answer HQ doesn't send alerts or scheduled digests, so this stays a monthly habit you do rather than a notification you get. What it removes is the tagging, the grouping and the transcript reading. Insights is included on Pro at $299 a month with no per-agent charge.
FAQ
What can I learn from customer support data?
Which pages confuse people, which answers are missing, where customers stop trusting your copy, and what they want you to sell. Counts matter more than individual messages: one person asking about sizing is noise, thirty people asking is a product page that needs a table. The unanswered questions are usually the most valuable part.
How do I analyze customer support questions without a data team?
Tag 30 days of questions with short labels in a spreadsheet and sort by count. That's enough to find your top three problems. Tools help by grouping questions that mean the same thing and by tracking which ones your content couldn't answer, which is the part that's tedious by hand.
How often should I review support questions?
Monthly is the right cadence for most small businesses. Weekly is noise unless you're launching something, and quarterly means you find out about a broken page ten weeks late. Thirty minutes a month with the top topics and the unanswered list is enough.
Can I get alerts when something changes in my support volume?
Answer HQ doesn't do alerting or scheduled reports today; Insights is a dashboard you open. If you want something closer to a push, the practical version is a recurring calendar block, plus asking Autopilot about the last few weeks when you sit down.
Does this work if I only get a few questions a month?
Yes, and it's easier. At low volume you can read every question, and the exercise is really about writing the answers down so you stop repeating yourself. Grouping and ranking matter once you're past the point where one person can hold the pattern in their head.
If your questions are currently scattered across an inbox and a chat log, that's the thing to fix first. Start a 14-day trial, point Answer HQ at your site, and give it a month of real questions to group.